Injest Prometheus Data Into OpenSearch
Overview
You can ingest and visualize metric data from log data aggregated within OpenSearch, allowing you to analyze and correlate data across logs, traces, and metrics.
With this feature, you can observe your digital assets with more granularity, gain deeper insight into the health of your infrastructure, and better inform your root cause analysis.
The following image shows the process of ingesting metrics from Prometheus and visualizing them in a dashboard.
Configuring a data source connection from Prometheus to OpenSearch
You can view metrics collected from Prometheus in OpenSearch Dashboards by first creating a connection from Prometheus to OpenSearch using the SQL plugin.
To configure a connection to Prometheus, create a file on your OpenSearch nodes named datasources.json containing the Prometheus data source settings. The following examples demonstrate the various Prometheus data source configurations using different authentication methods.
No authentication:
[{
    "name" : "my_prometheus",
    "connector": "prometheus",
    "properties" : {
        "prometheus.uri" : "http://localhost:9090"
    }
}]
Basic authentication:
[{
    "name" : "my_prometheus",
    "connector": "prometheus",
    "properties" : {
        "prometheus.uri" : "http://localhost:9090",
        "prometheus.auth.type" : "basicauth",
        "prometheus.auth.username" : "admin",
        "prometheus.auth.password" : "admin"
    }
}]
After configuring Prometheus in the datasources.json file, run the following command to load the configuration into the OpenSearch keystore. The configuration is securely stored in the keystore because it contains sensitive credential information.
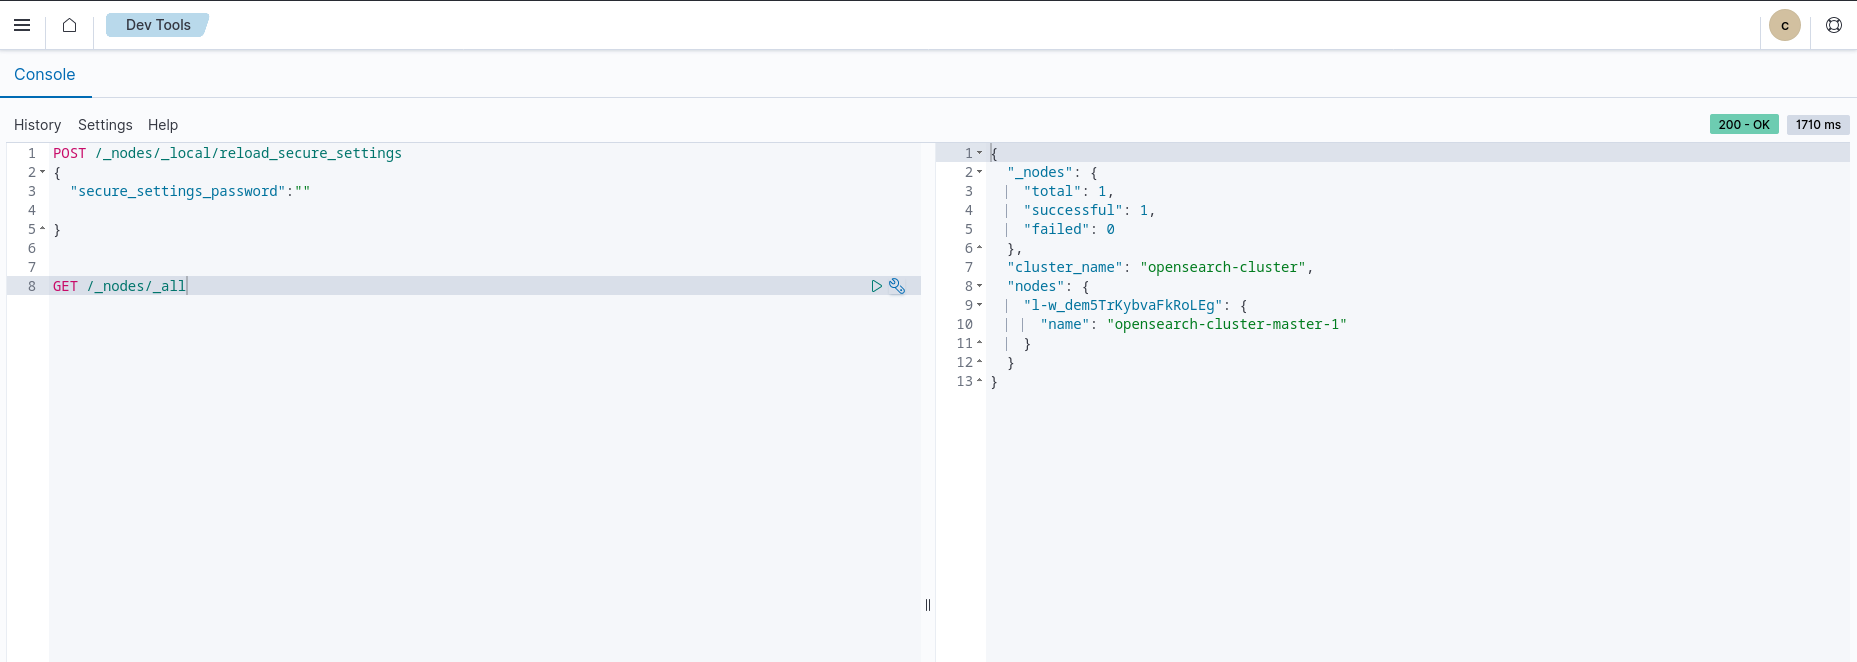
If you are updating the keystore during runtime, refresh the keystore by reloading secure settings. Run the following json in the dev tools console until each node endpoint is hit:
Example in dev console:
After configuring the connection from Prometheus to OpenSearch, Prometheus metrics are displayed in Dashboards in the Observability > Metrics analytics window, as shown in the following image.
For more information, see the Prometheus Connector GitHub page.
Creating visualizations based on metrics
You can create visualizations based on Prometheus metrics and other metrics collected by your OpenSearch cluster.
To create a visualization, do the following:
- In Observability > Metrics analytics > Available Metrics, select the metrics you would like to include in your visualization.
- These visualizations can now be saved.
- From the Metrics analytics window, select Save.
- When prompted for a Custom operational dashboards/application, choose one of the available options.
- Optionally, you can edit the predefined name values under the Metric Name fields to suit your needs.
- Select Save.
The following image shows an example of the visualizations that are displayed in the Observability > Metrics analytics window.
Defining PPL queries for use with Prometheus
You can define Piped Processing Language (PPL) queries against metrics collected by Prometheus. The following example shows a metric-selecting query with specific dimensions:
source = my_prometheus.prometheus_http_requests_total | stats avg(@value) by span(@timestamp,15s), handler, code
Additionally, you can create a custom visualization by performing the following steps:
- From the Events Analytics window, enter your PPL query and select Refresh. The Explorer page is now displayed.
- From the Explorer page, select Save.
- When prompted for a Custom operational dashboards/application, choose one of the available options.
- Optionally, you can edit the predefined name values under the Metric Name fields to suit your needs.
- Optionally, you can choose to save the visualization as a metric.
- Select Save.
Note: Only queries that include a time-series visualization and stats/span can be saved as a metric, as shown in the following image.
Add Prometheus certs to trust store
Try to tweak the ElasticSearch documentation for using a custom JVM trust store but with the prometheus certs instead of s3
To configure the OpenSearch Helm chart to trust the SSL certificate used by Prometheus, you can follow these steps:
1. Retrieve the Prometheus CA certificate: Obtain the CA certificate used to sign the SSL certificate presented by Prometheus. This can typically be done by contacting the administrator or referring to Prometheus’s documentation.
To retrieve the entire CA chain for Prometheus using OpenSSL, you can modify the previous command slightly to include the additional certificates in the chain. Here’s an updated command:
openssl s_client -showcerts -connect <prometheus_host>:<prometheus_port> </dev/null | awk '/BEGIN/,/END/{ if(/BEGIN/){a++}; out="prometheus-ca" a ".crt"; print > out}'
Replace <prometheus_host> with the hostname or IP address of your Prometheus server, and <prometheus_port> with the port number on which Prometheus is running.
This command connects to the Prometheus server, retrieves the SSL certificate chain, and saves each certificate in separate files. The files will be named prometheus-ca1.crt, prometheus-ca2.crt, and so on, depending on the number of certificates in the chain.
2. Store the CA certificate in a Kubernetes secret: Create a Kubernetes secret to store the Prometheus CA certificate. Use the following command, replacing <path_to_ca_certificate> with the actual path to the CA certificate file:
kubectl create secret generic prometheus-ca-cert --from-file=prometheus-ca1.crt --from-file=prometheus-ca2.crt -n opensearch
Make sure to replace prometheus-ca1.crt, prometheus-ca2.crt, etc., with the actual file names generated by the OpenSSL command.
3. Update the OpenSearch Helm values: Modify the values of the OpenSearch Helm chart to include the necessary configuration for trusting the Prometheus CA certificate. Open the values.yaml file associated with the OpenSearch Helm chart and make the following changes:
- Add the following section under the
opensearchkey to configure the truststore.
opensearch:
  config:
    opensearch_security.ssl.transport.pemtrustedcas_filepath: /usr/share/opensearch/config/certs/prometheus-ca.crt
- Add the following section under the extraEnvs key to configure the environment variable used by OpenSearch:
extraEnvs:

  - name: OPENSEARCH_JAVA_OPTS
    value: -Djavax.net.ssl.trustStore=/usr/share/opensearch/config/certs/truststore.jks
- Add the following section under the extraVolumes key to mount the Prometheus CA certificate secret as a volume:
extraVolumes:
  # a place to store copied certs, filled by init container bash script, then mounted into opensearch container

  - name: certificates-data
    emptyDir: {}
  # volume from the tls secret, mounted into the init container only via its volumeMounts
  - name: prometheus-ca-cert
    secret:
      secretName: prometheus-ca-cert
- Add the following section under the extraVolumeMounts key to mount the Prometheus CA certificate secret to the OpenSearch container:
- Add the following section under the extraInitContainers key to fix the permissions of the mounted certificate secret in the OpenSearch container:
extraInitContainers:

  - name: fixcerts
    image: docker.io/bitnami/bitnami-shell:10-debian-10-r199
    imagePullPolicy: "IfNotPresent"
    command:
      - /bin/bash
      - -ec
      - |
        cp /certs/* /certs-copy
        chown -R 1000:1000 /certs-copy

    volumeMounts:
      # tls cert source, from the secret volume

      - mountPath: /certs
        name: prometheus-ca-cert
      # the output volume - the mount path can be anything but needs to match bash script above
      - mountPath: /certs-copy
        name: certificates-data
4. Append the Prometheus CA chain certificates to the existing OpenSearch truststore.
By appending the Prometheus CA chain certificates to the existing OpenSearch truststore, you ensure that both the existing trusted certificates and the Prometheus CA chain certificates are recognized by OpenSearch when establishing secure connections.
- Export the Prometheus CA chain certificates as separate PEM files (assuming you already have the Prometheus CA chain certificates in separate files as mentioned earlier):
cat prometheus-ca1.crt >> prometheus-ca-chain.crt
cat prometheus-ca2.crt >> prometheus-ca-chain.crt
cat prometheus-ca3.crt >> prometheus-ca-chain.crt
This command concatenates the individual Prometheus CA chain certificates into a single file named prometheus-ca-chain.crt. Adjust the command based on the actual filenames and order of the certificates.
- Copy the existing
truststore.jksfile from the Kubernetes pod to your local machine using thekubectl cpcommand:
Replace
<pod_name> with the name of your OpenSearch pod.
- Convert the PEM file to a Java KeyStore (JKS) format:
- Mount the truststore file to the OpenSearch container:
In the values.yaml file associated with the OpenSearch Helm chart, add the following section under the extraVolumeMounts key to mount the truststore file to the OpenSearch container:
extraVolumeMounts:

  - name: truststore
    mountPath: /usr/share/opensearch/config/certs/truststore.jks
    subPath: truststore.jks
- Update the OpenSearch Java options:
In the values.yaml file, add or modify the following section under the extraEnvs key to set the OpenSearch Java options:
extraEnvs:

  - name: OPENSEARCH_JAVA_OPTS
    value: -Djavax.net.ssl.trustStore=/usr/share/opensearch/config/certs/truststore.jks -Djavax.net.ssl.trustStorePassword=<truststore_password>
- You may need to temporarily update the podSecurityContext to be able to chown the certs properly
Then be sure to change them back to the correct user
5. Install or upgrade the OpenSearch Helm chart: Deploy or upgrade the OpenSearch Helm chart with the modified values by running the following command from the directory where the chart is located:
shell
Additional Resources
Created : 7 mai 2023